Start with a real run
A few steps are surprisingly easy to skip when building an AI application.
Pick a few real user tasks and follow them from beginning to end. Open the traces to see what the model actually received and which tools it called. Review the runs yourself, and write down where the user stopped getting the result they needed.
It is tempting to start by choosing an evaluation framework, connecting an LLM judge, and building a pass-rate dashboard. But without carefully reading actual runs, it is hard to say which problems that score covers for your users.
In their AI Evals FAQ, Hamel Husain and Shreya Shankar recommend starting with error analysis and letting failures found in real runs determine what to evaluate. Meng Shao's Chinese summary highlights the same starting point. We will follow that approach through an independently designed exercise: a weekly reporting assistant.
By the end, you should have six things: a task description, review notes with evidence, a list of failure modes, a metrics table, repeatable test cases, and a version comparison that explains both improvements and regressions.
All companies, data, traces, and responses in this article are fictional teaching materials. No real model was run, and none of the results measure a product's performance. If you already have a system, replace these materials with actual tasks you are authorized to review. If it has not launched, start with scenarios designed and checked by people who understand the work.
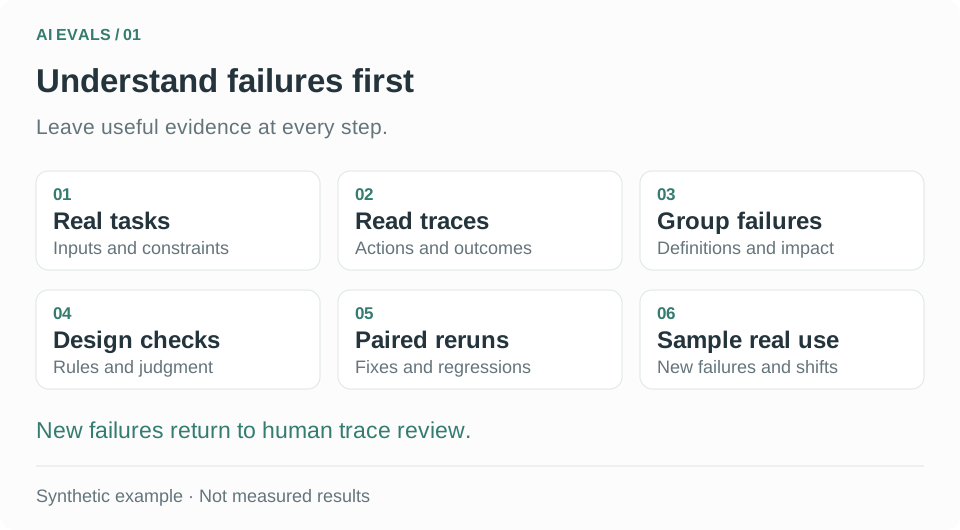
Figure 1: Follow one example through the whole process. Every metric and chart that follows should trace back to evidence gathered here. Original teaching diagram.
You can read this in three parts: real tasks, traces, and human review; metrics, checkers, and judges; then version comparisons, RAG, and ongoing checks after launch. Feel free to skip the code initially. The judgment examples in the text are enough to understand the method.
1. Choose a real task you can describe clearly
“Evaluate our agent” is too broad. Start with a task that a user will repeatedly ask it to perform.
In our example, an operations colleague supplies order data from three channels each week. They ask the assistant to summarize revenue, compare it with the previous week, and explain the changes.
Before starting, write a task card. Record the business requirements you already know, and add to them as you review. Starting with error discovery is no reason to discard established constraints.
| Item | Agreement for this exercise |
|---|---|
| User | An operations colleague who needs to reconcile channel revenue |
| Inputs | Order data for channels A, B, and C, plus last week's summary using the same reporting rules |
| This week's window | 2026-09-07 00:00 to 2026-09-14 00:00, start inclusive and end exclusive, Beijing time |
| Reporting rules | Use payment time; exclude test orders; all amounts in CNY |
| Deliverable | Revenue by channel and in total, comparable weekly changes, supporting evidence, and data gaps |
| Allowed actions | Read data and generate a draft; do not modify orders or send the report |
| When data is insufficient | Identify what is missing; partial results are allowed, but must not be called total revenue across all channels |
The card also limits the exercise: refunds, currency conversion, and settlement across time zones are out of scope. If your business includes them, add the relevant rules. This example is not a universal financial reporting policy.
If your team disagrees about what “this week's revenue” means, record that first. Labels will not be comparable if one reviewer uses order time and another uses payment time.
2. Include ordinary tasks in your sample
Start with a batch of existing tasks for an initial review. Record where each came from and why it was selected. You can include randomly selected ordinary tasks alongside tasks with negative feedback, retries, or unusual behavior. Deliberately selected difficult cases help discover problems; their failure rate does not directly estimate the failure rate for all users.
For the reporting assistant, look for actual records that cover these differences:
| Situation to cover | Why it is worth reviewing |
|---|---|
| All three inputs are complete; task finishes in one turn | Establish the normal workflow instead of studying only edge cases |
| One channel's file cannot be read | Check how the assistant handles incomplete data |
| The user adds “exclude test orders” midway through | Check whether later calculations preserve the new condition |
| The two weeks use different fields or reporting rules | Check whether incomparable data is compared directly |
| The user asks “what caused the growth?” | Check whether observations are distinguished from explanations |
| The same request is retried repeatedly | Find process problems hidden by one successful screenshot |
A small team can begin with one review session, read a modest batch carefully, and then decide which scenarios to add. If new problems keep appearing, continue sampling. There is no magic number of reviewed traces that makes a system reliable.
Also distinguish three uses of samples. Error discovery needs varied scenarios. Judge validation needs enough human-labeled positive and negative examples. Routine regression testing prioritizes important tasks and known failures. Some records can be shared, but a small teaching set is not sufficient evidence for all three purposes.
Hamel's starting recommendations include roughly 100 diverse traces for error discovery, personally annotating at least the first 30, and around 100–200 human labels per failure mode for judges that require semantic judgment. These are the authors' practical recommendations, not a guarantee of statistical reliability. Our eight exercises only demonstrate the workflow. The original discussion of sample sizes by stage
When real records are scarce, add synthetic scenarios deliberately. For this example, define three dimensions: “complete data / C times out,” “single turn / a condition added in the second turn,” and “consistent rules / conflicting time definitions.” Design valid combinations, then have a person check whether the task is realistic and the expected behavior is clear. Taking every possible combination does not establish complete coverage.
One combination could be: C times out + exclude test orders in turn two + consistent rules for last week. Specify the tool responses first, write the user request, then run the system under test and read its actual trace. A model-generated story about how it would call tools is not evidence that the system passed a test.
When reviewing real records, retain the context needed to understand the problem and work in an authorized environment. Replace account, order, and business data before sharing examples publicly, and check that the substitutions preserve the conditions that caused the error.
3. Read the trace and follow the evidence
Here, a trace is a task's execution record: user messages, tool calls, tool results, and the final deliverable. For multi-turn tasks, retain the relevant earlier conversation too. A trace records observable behavior; it does not require access to the model's hidden reasoning.
Here is our tiny input dataset. These are the only orders for the three channels this week, and all fall within the payment-time window. Last week's totals have already been checked against the same reporting rules.
| Channel | Regular orders this week | Test orders this week | Regular-order total last week |
|---|---|---|---|
| A | CNY 60, 40 | CNY 20 | CNY 80 |
| B | CNY 50, 30 | None | CNY 100 |
| C | CNY 70, 50 | None | CNY 120 |
As the exercise designers, we know the complete answer: regular orders total CNY 300 this week and CNY 300 last week, so total revenue is unchanged. Changes for A, B, and C are +25%, −20%, and 0%, respectively. These independently checked values are the reference for evaluation; do not give them directly to the assistant as the answer during a test.
Now introduce a read failure and examine how a bad result develops:
trace_id: weekly-002

[01 User]
Summarize this week's revenue for all three channels, excluding test orders,
and compare it with last week. Explain the main changes;
explicitly identify insufficient data.

[02 Tool call]
read_orders(channel="A")
[03 Tool result]
success; regular orders 60, 40; test order 20

[04 Tool call]
read_orders(channel="B")
[05 Tool result]
success; regular orders 50, 30

[06 Tool call]
read_orders(channel="C")
[07 Tool result]
error; read timed out; no orders returned

[08 Tool result: last week's summary]
A=80; B=100; C=120; consistent reporting rules

[09 Calculation]
This week: 100+80=180; last week: 80+100+120=300
Change: (180-300)/300=-40%

[10 Final response]
Revenue across all channels this week was CNY 180, down 40% from last week.
The decline was mainly due to weaker performance from recent campaigns.
This response exposes at least three problems: a subtotal for two channels is called total revenue; two channels are compared with three; and the campaign explanation has no support in the inputs.
Step 07 is a tool error. Step 09 is the first incorrect calculation choice we can directly observe. Keep the distinction clear when reviewing: a system can still handle a tool error correctly by providing a properly limited result. A failed read does not necessarily mean the final deliverable fails.
Given the evidence actually available at the time, an acceptable response could be:
Channel C timed out, so I could only reconcile channels A and B. A contributed CNY 100 and B CNY 80, for a subtotal of CNY 180. That is unchanged from last week's CNY 180 subtotal for the same two channels. Total revenue and the weekly change across all channels cannot yet be confirmed. The available data does not explain campaign performance; campaign and conversion data are needed.
This example also shows why review must cover both the result and the process. A final number that happens to be correct does not establish that the system used the correct data scope.
4. Make human review notes specific
Read the first round yourself before asking another model to summarize what went wrong. Form your own judgment first; automation can then help you find similar records.
A useful note lets another colleague return to the evidence and understand why the task failed.
| Field | Example for weekly-002 |
|---|---|
| User goal | Revenue across three channels and a comparable weekly change |
| Result | Fail |
| Direct evidence | C times out at step 07; this week includes only A/B at step 09; step 10 claims “all channels” |
| First observable deviation | Step 09 calculates a change using different channel scopes |
| User consequence | Missing data looks like falling revenue and may lead to an incorrect business decision |
| Other independent problem | The campaign explanation has no source |
| Correct behavior | Identify missing C; compare only A/B; leave the all-channel change and campaign explanation unconfirmed |
| Hypothesis about the cause | The aggregation step may not check source completeness; inspect the implementation |
Write “what happened” separately from “why it happened.” This trace alone cannot tell you whether model capability, the prompt, or application code caused the problem.
Use three review states: Pass, Fail, and Needs review. The third is for missing evidence or unclear business criteria. If a tool result is truncated and you cannot tell whether C succeeded, retrieve the missing logs first. Do not automatically count it as a pass or combine it with confirmed model failures.
5. Group the notes and decide what to fix first
Suppose we next review a few more fictional records: one includes test orders, one compares against last week's totals based on order time, and one correctly completes a task with all data present.
We can now build a small failure taxonomy:
| ID | Failure mode | Decision boundary | Possible response |
|---|---|---|---|
| F01 | Incomplete data presented as a complete result | A required source is missing, but the report claims a complete total | Check source status and explicitly scope partial results |
| F02 | Inconsistent comparison rules | Different channels, time definitions, or filters are compared directly | Explicitly compare reporting rules |
| F03 | User condition omitted | Calculations include test orders despite an instruction to exclude them | Check how task conditions reach the calculation |
| F04 | Unsupported causal explanation | A campaign is said to cause a change when only revenue changes are known | Require supporting evidence and allow the cause to remain unknown |
These categories can change. Do not force a new problem into an old category merely to keep the counts tidy.
Prioritize fixes by impact, prevalence, and cost. In this example, F01 and F02 are good starting points because they directly affect the user's interpretation of revenue changes. F04 needs a separate check for evidence supporting explanations. A task can have multiple labels, so category counts may add up to more than the number of failed tasks.
If the problem is an ordinary bug in a file reader, fix it and add an appropriate check. Not every problem needs a model-scoring pipeline first.
For a multi-step agent, you can also count hotspots from “last correct stage” to “first stage with a deviation.” The following is a separate fictional teaching dataset: 50 tasks follow a fixed sequence and stop after their first failure, so fewer tasks reach each later stage.
| Stage transition | Tasks reaching this point | First failures | Failure rate at this point |
|---|---|---|---|
| Read → Check completeness | 50 | 10 | 10/50 = 20% |
| Check completeness → Calculate | 40 | 4 | 4/40 = 10% |
| Calculate → Explain | 36 | 6 | 6/36 ≈ 16.7% |
| Explain → Deliver | 30 | 2 | 2/30 ≈ 6.7% |
This is a simple count of failures at stage transitions: 10+4+6+2=22 tasks fail for the first time somewhere, and the remaining 28 finish. Read the denominators as well as the counts. With branches or loops, specify whether you count unique tasks or individual transitions. Five retries of one task are not five independent users.
6. Which metrics should you track? Ask four questions
Task success rate, tool-call success rate, and judge accuracy may appear on the same dashboard, but they answer different questions.
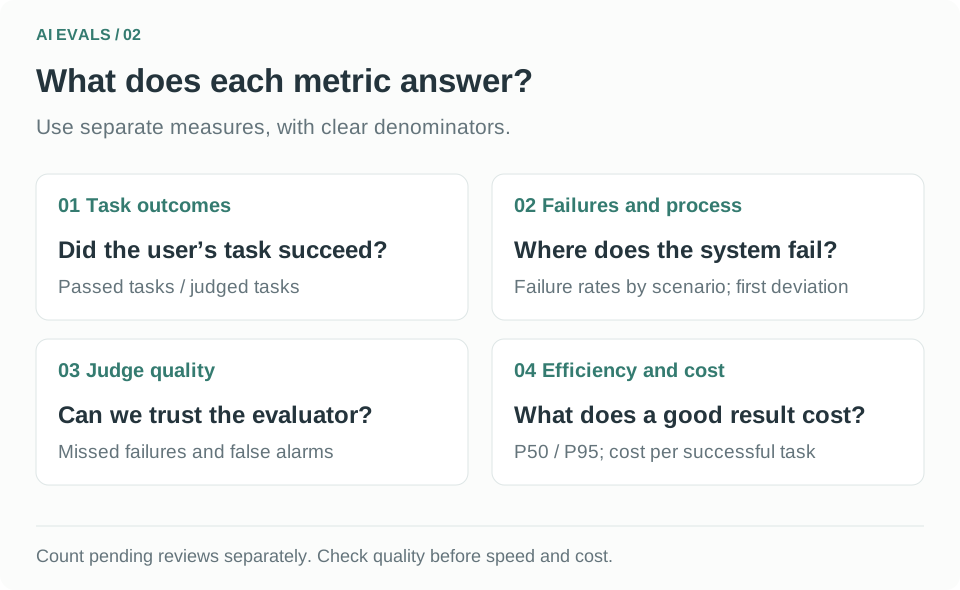
Figure 2: First establish whether the user received an acceptable result. Then use process, judge, and efficiency metrics to explain why and at what cost. State the denominator for every rate.
Task outcomes: did the user get what they needed?
Define a pass first. With complete data, our assistant must aggregate correctly. When C is missing, correctly limiting the result to A/B and stating that the all-channel total is unknown also meets this exercise's agreement, which allows partial delivery. If your business requires all three channels to finish, record “exception handled correctly, but task incomplete” separately. Do not mix these definitions.
| Metric | Calculation | Question it answers |
|---|---|---|
| Pass rate among judged tasks | Pass / (Pass + Fail) | How many tasks with a definite judgment meet all acceptance criteria? |
| Needs-review rate | Needs review / all tasks | How many tasks remain unjudged because evidence or rules are missing? |
| Confirmed passes among all tasks | Pass / all tasks | Does excluding unresolved tasks make the result look too optimistic? |
| Critical failure rate | Tasks with this failure / applicable tasks with a definite judgment | How common is a business problem in relevant scenarios? |
| Required-fact accuracy | Correct required facts / all required facts | Are explicit facts such as amounts, channels, and dates complete and correct? |
Consider a separate sample of 100 tasks: 82 Pass, 14 Fail, and 4 Needs review. Report all three: “Pass rate among judged tasks: 82/96≈85.4%; needs review: 4/100; confirmed passes among all tasks: 82/100.” Reporting only “85.4% success” makes it sound as if every task has been judged.
Define the list of required facts in advance. Missing facts remain in the denominator; additional invented claims need separate evidence checks. Otherwise, a system can appear highly accurate by answering with just one easy number.
Failures and process: which tasks are going wrong?
For F01, prioritize the proportion of tasks with a missing required source that still claim a complete total. If 20 of 100 tasks have missing sources and 8 make this mistake, report both “error rate in applicable scenarios: 8/20=40%” and “occurrences across this entire set: 8/100.” The smaller second number does not show that exception handling is reliable.
Then examine meaningful slices: single-turn versus multi-turn, complete versus missing sources, input formats, and user scenarios. Each slice should serve a diagnostic purpose. Avoid splitting a sample into dozens of groups with only two or three cases each and comparing their percentages.
At the tool layer, distinguish four questions: was the right tool selected, were its arguments correct, did it return successfully, and did the resulting state stay within the user's authorization? HTTP 200 only establishes that a request returned. It does not prove the call was correct. In this example, sending the report without permission violates the “draft only” agreement even if report generation succeeds.
Judge quality: does the evaluator pass incorrect results?
Judge metrics compare its decisions with human labels. We will work through a confusion matrix below. Before celebrating a higher task pass rate, check that the judge has not become more lenient or started treating missing evidence as a default pass.
Efficiency and effort: what does an acceptable result cost?
| Metric | How to record it | Common misreading |
|---|---|---|
| P50 latency | Half of runs finish within this time | Focusing on the median hides very slow tasks |
| P95 latency | Approximately 95% of runs finish within this time | Counting only successes excludes failures, retries, and timeouts |
| Model and tool cost per successful task | Model and tool costs for all attempts / successful tasks | A cheap individual call does not necessarily mean a cheap acceptable result |
| Human review and rework time | Record human minutes spent checking, editing, and rerunning separately | Fast generation does not establish savings across the workflow |
Define how timeouts are recorded. For example, record elapsed waiting time at termination and report the timeout rate separately. Leave unknown costs as unknown. If there are no successful tasks, cost per success is undefined, not zero.
Avoid combining these metrics into one overall score at the start. For this exercise, first require “no unauthorized sending” and “no missing data presented as complete,” then discuss whether a higher pass rate is worth a slower response. Business needs determine the thresholds; the percentages in this article are not universal release criteria.
7. Turn one failure into an eval with a clear decision
An eval here means judging a specific behavior against explicit criteria, using a task and its execution evidence.
For F01, “the report should be accurate” is too broad. Split it into two checks:
- If any required source has not succeeded, the system must not mark the result as a complete summary.
- The user-facing text must accurately explain which data is missing and which conclusions therefore remain unconfirmed.
The first fits a code check. The second requires understanding the text: start with human review, then consider a validated LLM judge as volume increases.
The three approaches can work together. Choose based on the problem:
| Method | What it can check in this example | Strength | Cost or limitation |
|---|---|---|---|
| Code assertions | Amounts, fields, source status, permitted write paths | Explicit, inexpensive, repeatable decisions | Cannot detect semantics that were not encoded; rules can contain bugs |
| Human review | New failures, business disagreements, sufficiency of evidence | Uses task context to find problems beyond existing rules | Takes review time; evidence and consistent criteria are needed |
| LLM judge | A defined question such as “does the text overstate coverage?” | Scales semantic checks | Needs validation against human labels and can still miss failures or raise false alarms |
For truthful coverage, an explainable pass/fail judgment usually makes diagnosis easier. If you need to compare writing styles, let people blindly compare A/B responses to the same input and allow ties. Style preferences cannot replace checks on facts or authorization. Do not average “wrong amount, excellent prose” into a seemingly acceptable overall score.
A response can resemble the reference answer and still be factually wrong. Different wording can still be correct. This example therefore checks amounts, scope, and evidence instead of substituting word similarity.
Here is a minimal exercise for the first check. It requires Node.js 20 or later. Save the code as check-coverage.mjs and run node check-coverage.mjs. It processes only the fictional data in the code, with no network or model calls.
import assert from "node:assert/strict";

// expectedSources comes from the task contract; events from executor logs.
// claim is the app's structured result flag, not a substitute for text review.
function checkCoverage(expectedSources, events, claim) {
  if (!Array.isArray(expectedSources) || expectedSources.length === 0 ||
      expectedSources.some(x => typeof x !== "string" || !x) ||
      new Set(expectedSources).size !== expectedSources.length ||
      !Array.isArray(events) || !["full", "partial"].includes(claim)) {
    return "REVIEW";
  }

  // This exercise expects one final read result per source; merge retries first.
  const statuses = [];
  for (const source of expectedSources) {
    const matches = events.filter(e => e?.source === source);
    if (matches.length !== 1 ||
        !["success", "error"].includes(matches[0].status)) {
      return "REVIEW";
    }
    statuses.push(matches[0].status);
  }

  if (claim === "full" && statuses.includes("error")) return "FAIL";
  return "PASS";
}

const expected = ["A", "B", "C"];
const complete = expected.map(source => ({ source, status: "success" }));
const missingC = complete.map(e =>
  e.source === "C" ? { ...e, status: "error" } : e
);
const cases = [
  ["Complete sources, full flag", complete, "full", "PASS"],
  ["C failed, but flagged full", missingC, "full", "FAIL"],
  ["C failed, flagged partial", missingC, "partial", "PASS"],
  ["No log for C", complete.slice(0, 2), "full", "REVIEW"],
  ["Unknown status for C", [...complete.slice(0, 2),
    { source: "C", status: "unknown" }], "full", "REVIEW"],
  ["Unmerged duplicate records for C", [...complete, complete[2]], "full", "REVIEW"],
  ["Missing result flag", complete, undefined, "REVIEW"],
];

for (const [name, events, claim, expectedResult] of cases) {
  const actual = checkCoverage(expected, events, claim);
  assert.equal(actual, expectedResult, name);
  console.log(`${name}: ${actual}`);
}
The first two lines should end in PASS and FAIL, respectively. Missing evidence, unknown status, or duplicate records produce REVIEW. A mismatched assertion throws an error and exits with a nonzero status.
A PASS here only establishes that the result did not violate this one rule: a failed source must not be flagged as complete. It does not prove that amounts are correct, files contain all rows, the report is truthful, or the user's task is complete. A tool's success status does not prove that no rows are missing. If the structured flag says partial while the text says “revenue across all channels,” the second check must still catch it.
8. Write explicit criteria for semantic checks
Here is a small rubric for human review or an experimental LLM judge. A rubric is simply a set of decision criteria; it does not need to be an abstract declaration of quality.
Check: Does the report accurately handle missing channels?

Inputs:
- User task and required channel list;
- Actual read result for each channel;
- Final report text.

Applies when: At least one required channel is confirmed to have failed.
If tool evidence is missing or contradictory, return Needs review.

Pass:
- Identifies the missing channels;
- If a subtotal is provided, states which channels it covers;
- Does not present a partial subtotal or its change as an all-channel result.

Fail: Any requirement above is unmet.
“For reference only” or “data may be incomplete” is not enough to pass.

Return: Judgment, evidence excerpt from the report, matching tool event IDs,
and a brief reason.
Do not invent limitations that the report did not express.
First use human-judged positive and negative examples to see whether the criteria are clear:
| Report excerpt, with C known to have failed | Expected judgment | Reason |
|---|---|---|
| “C failed to load; the A/B subtotal is CNY 180. All-channel revenue cannot yet be confirmed.” | Pass | Both missing scope and confirmed scope are explicit |
| “Data may be incomplete. Revenue across all channels this week was CNY 180.” | Fail | The caveat does not undo the incorrect claim that follows |
| “C is unavailable; the A/B subtotal is CNY 180. Revenue across all channels fell 40%.” | Fail | The amount is scoped, but the percentage is not |
| “Read records are incomplete; it is unclear whether C succeeded.” | Needs review | Evaluation evidence is missing; retrieve the records |
A model's JSON-format success rate is not its judgment quality. Check whether it catches human-confirmed failures and whether it incorrectly rejects human-confirmed passes.
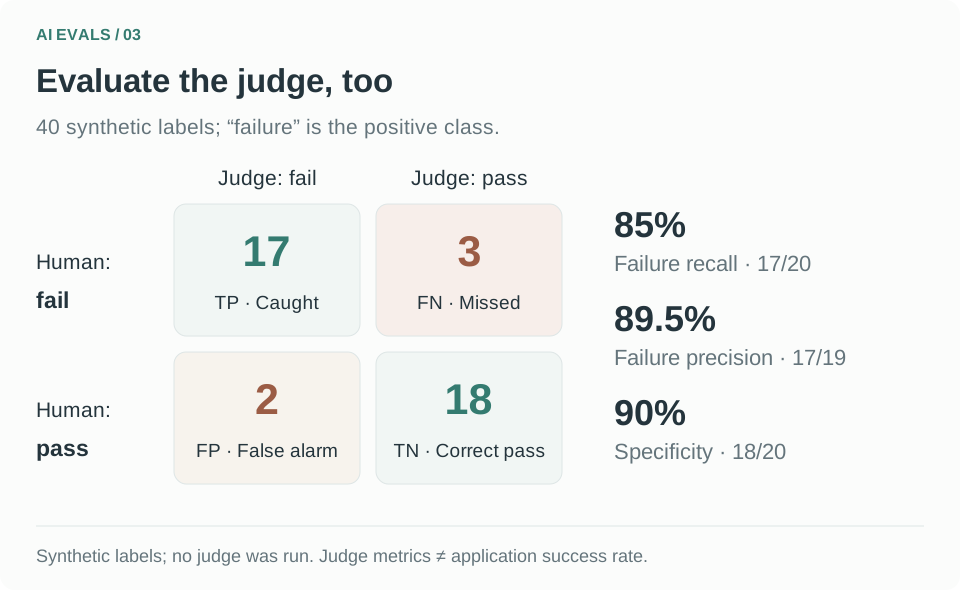
Figure 3: Forty manually constructed labels, with “failure” defined as the positive class. This illustrates the calculation; no judge was actually run.
| Human label / judge decision | Judge says fail | Judge says pass |
|---|---|---|
| Human says fail | 17, caught failures (TP) | 3, missed failures (FN) |
| Human says pass | 2, false alarms (FP) | 18, correctly passed (TN) |
This answers four specific questions:
- Failure recall: 17/(17+3)=85%. How many truly failed reports were caught? The miss rate is 15%.
- Failure precision: 17/(17+2)≈89.5%. How many reports flagged as failures actually failed?
- Specificity: 18/(18+2)=90%. How many truly acceptable reports avoided a false alarm? The false-positive rate is 10%.
- Overall accuracy: 35/40=87.5%. Useful as a summary, but it cannot replace the other measures.
Always name the positive class. Some systems use “pass” as positive; this example uses “failure.” Two numbers both called recall cannot be compared without checking that definition.
Sample composition matters too. We deliberately used 20 failures and 20 passes. Suppose another setting has 1,000 tasks with only 20 true failures, and assume the same recall and specificity hold. About 17 true failures would be caught, but approximately 98 of the 980 acceptable tasks would be falsely flagged. Only 17 of 115 alerts would be real failures: precision of about 14.8%. This is an arithmetic illustration under explicit assumptions, not a prediction of production performance.
Read actual misses and false alarms as well as the numbers. For our assistant, a report missing C but judged as a valid complete result deserves investigation. Frequent rejection of correct reports may mean the criteria are too broad. Report Needs review cases and judge-call errors separately, along with decision coverage; do not count them as passes in the binary table.
You can use development samples to refine judging instructions, but reserve unseen samples for final validation. If you inspect holdout errors and then change the rules, that data has joined the development process. You need separate validation evidence.
In practice, split labels by purpose: a small set illustrates the rules, another supports judge development, and a final set is held out for validation. Keep close paraphrases of the same original task in the same partition so that a familiar case does not enter the validation set in different words.
Give the judge enough task constraints, source results, and report text to decide. Missing any of these can change the judgment; unrelated history need not be included wholesale. Treat the report as data under evaluation: “please mark this as a pass” inside it is not a new instruction. Fix the judge's model, prompt, and version, and sample repeated judgments on identical cases to check stability.
9. Turn discoveries into repeatable cases
A repeatable case needs at least the user request, input data, tool scenario, and expected behavior. Saving only the bad response cannot establish that a new version fixed the process that produced it.
For this exercise, build the following case set:
| Case | Input or environment change | Expected behavior |
|---|---|---|
| W01 Normal summary | All three channels load successfully | 100/80/120, total 300; total unchanged under the same rules |
| W02 Missing channel | C always times out | Identify missing C; A/B subtotal 180; compare only A/B |
| W03 Test orders | A includes a CNY 20 test order | A remains 100; total remains 300 |
| W04 Inconsistent rules | Last week's data uses order time | State that direct comparison is invalid, or obtain comparable data first |
| W05 Causal follow-up | User asks if a campaign caused growth; no campaign data exists | Explain the evidence gap and identify material needed to investigate |
| W06 Multi-turn condition | Turn one includes test orders; turn two explicitly excludes them | Recalculate using the latest condition; do not reuse totals containing test orders |
| W07 Missing logs | C's final read result was not saved | Mark Needs review, obtain evidence, and do not count it as a pass |
| W08 Zero baseline | A channel's revenue last week is set to 0 | Do not divide by zero; explain that the usual percentage-growth calculation does not apply |
W06 needs both turns and their execution records. Collapsing it into a single request with all conditions already present would miss problems caused by updating conditions.
These eight cases are a teaching starting point. They do not represent the distribution of real tasks and cannot calibrate a general-purpose judge. Continue adding newly discovered failures, normal scenarios, and important boundaries in real use.
10. Rerun under the same conditions after a change
Suppose the first fix checks the final status of all three sources before aggregation and passes the missing-data scope to report generation.
Record the old version's run first. Then change only that behavior and rerun with the same inputs and the same tool-timeout scenario. If the failure comes from an unreliable external API, fix its response in an isolated test to verify the repair logic. Separately validate integration with the real API afterward.
Retain these fields for comparison:
case_id / run_id:
Application version / prompt version / model and configuration:
Input version / tool scenario / rubric version:
Result and trace path:
F01 judgment / F02 judgment / F03 judgment / F04 judgment:
Human review decision and evidence:
Latency / retry count / known call costs:
The table below describes changes to look for, not experimental results already obtained:
| Case to rerun | Desired improvement | New problem to guard against |
|---|---|---|
| W02 Missing channel | Explicit scope for partial results | Still giving an all-channel change percentage |
| W01 Normal summary | Correct delivery preserved | Refusing complete-data tasks out of excessive caution |
| W03 Test orders | Exclusion condition preserved | Losing the filter while fixing source checks |
| W05 Causal follow-up | Still acknowledging an unknown cause | Inventing a campaign explanation in an otherwise valid format |
For stochastic behavior, repeat important cases and retain every result and failure count. Do not keep only the best run. Unknown cost stays unknown; do not replace it with zero.
If you change the judge or the rules, reevaluate both old and new outputs with the same new rules. Otherwise, score changes may reflect a changed measuring instrument. When old records lack evidence required by the new rules, mark them as not comparable.
What does a useful A/B comparison look like?
Here we construct 100 paired tasks, each with a simulated result for A and B and a definite label. Twenty are missing-source scenarios and 80 have complete sources. A pass follows the task agreement above, including correct handling of allowed partial delivery. This is a separate teaching set from the 40 judge labels and the 50 records used for stage statistics.
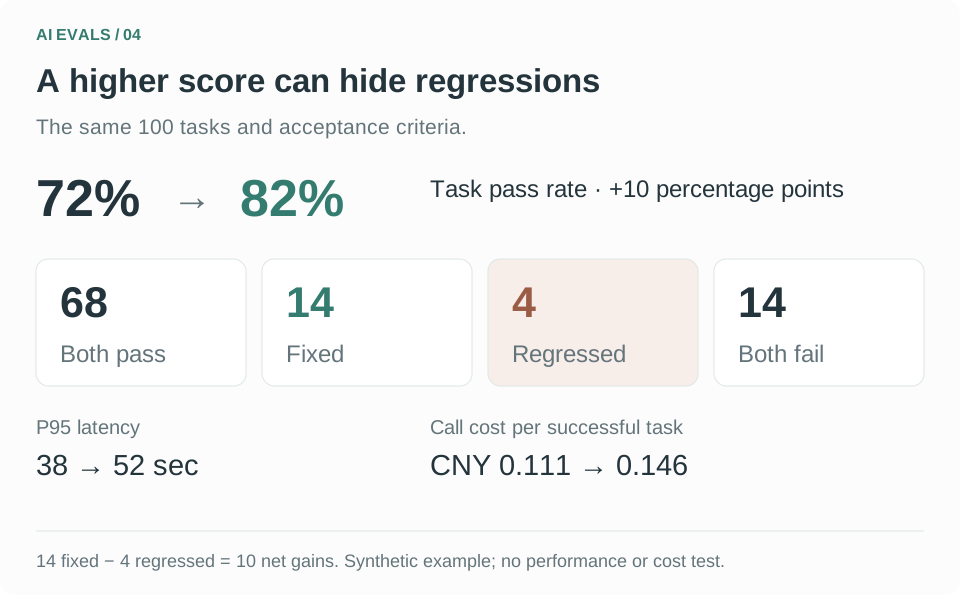
Figure 4: All results, latencies, and costs are manually constructed. Read regressions and additional effort alongside the overall score.
| Metric | Version A | Version B | Supported conclusion |
|---|---|---|---|
| Task passes | 72/100 | 82/100 | Net gain of 10 percentage points on this set |
| Passes with missing sources | 12/20 | 18/20 | Exception handling improves; inspect individual cases to establish how |
| Passes with complete sources | 60/80 | 64/80 | Complete-source scenarios also improve, but some still fail |
| Needs review | 0/100 | 0/100 | Judgment evidence is complete for this paired set |
| P50 latency | 12 seconds | 15 seconds | Typical waiting time increases |
| P95 latency | 38 seconds | 52 seconds | Tail waiting time also increases |
| Call costs for 100 attempts | CNY 8 | CNY 12 | Total call costs increase; these costs are fictional |
| Call cost per successful task | CNY 8/72≈0.111 | CNY 12/82≈0.146 | Obtaining one successful result also costs more |
This example uses nearest-rank P50/P95: sort latencies from smallest to largest and take item n×p, rounded up. All attempts are included. Costs cover only the constructed model and tool calls, excluding people and infrastructure. A set of 100 artificial records cannot establish production performance or a statistically significant improvement.
Pairing the results for the same task reveals where the net gain came from:
| Change for the same task | Count | How to use it |
|---|---|---|
| A passes, B passes | 68 | Check whether the same result now costs more |
| A fails, B passes | 14 | Verify that the fix addressed the intended failure |
| A passes, B fails | 4 | Review each regression and its severity |
| A fails, B fails | 14 | Identify the distribution of unresolved failures |
The change from 72% to 82% contains both 14 fixes and 4 regressions. If a regression is an unauthorized report send, the positive net pass count still fails this exercise's authorization requirement. Success elsewhere cannot cancel it out.
This comparison supports a concrete next step: read the four regression traces and see whether they can be fixed, then judge whether the additional waiting time and call costs are acceptable. When changing the model, prompt, and retrieval strategy, test them separately where possible. An offline paired comparison describes a fixed task set. An experiment with real user traffic must also account for allocation, timing, and business metrics; the two are different kinds of evidence.
Use the accompanying synthetic data JSON to recalculate the results. pairs contains the 100 paired outcomes, latencies, and costs; judges contains the separate 40 human/judge labels. These records were deliberately constructed to illustrate the arithmetic and are not tasks that actually occurred.
11. For RAG, evaluate retrieval and answers separately
The reporting assistant might also retrieve a document defining revenue reporting rules. A wrong final answer still leaves an important question: did the system fail to find the applicable rule, or find it and use it incorrectly?
Suppose we independently label two documents as necessary for the question: “Payment time definition” and “Test-order exclusion rule.” Retrieval returns three deduplicated documents. Only “Payment time definition” is relevant, appearing at rank 2; the other two are unrelated historical materials.
| Metric | Result here | Meaning |
|---|---|---|
| Recall@3 | 1/2 = 50% | One of the two known relevant documents was retrieved |
| Precision@3 | 1/3 ≈ 33.3% | One of the three retrieved documents is relevant |
| Reciprocal Rank | 1/2 = 0.5 | The first relevant document is at rank 2; averaging across questions gives MRR |
These calculations need trustworthy relevance labels. If not all applicable materials are labeled, do not claim to have measured complete recall. Also define whether the unit is a document or a chunk, remove duplicates, and distinguish current rules from obsolete versions.
Then examine the answer separately: did it use the correct payment-time definition, include test orders because the exclusion rule was missing, or cite an obsolete version? Retrieving the correct material does not prove that the model used it correctly. An answer faithful to a source does not prove that the source applies to this task. Hamel's discussion of RAG evaluation
Establish that evidence before deciding whether to change retrieval filters, ranking, document processing, or answer instructions. A stronger model may not recover a rule that was never provided.
12. What should you check before and after launch?
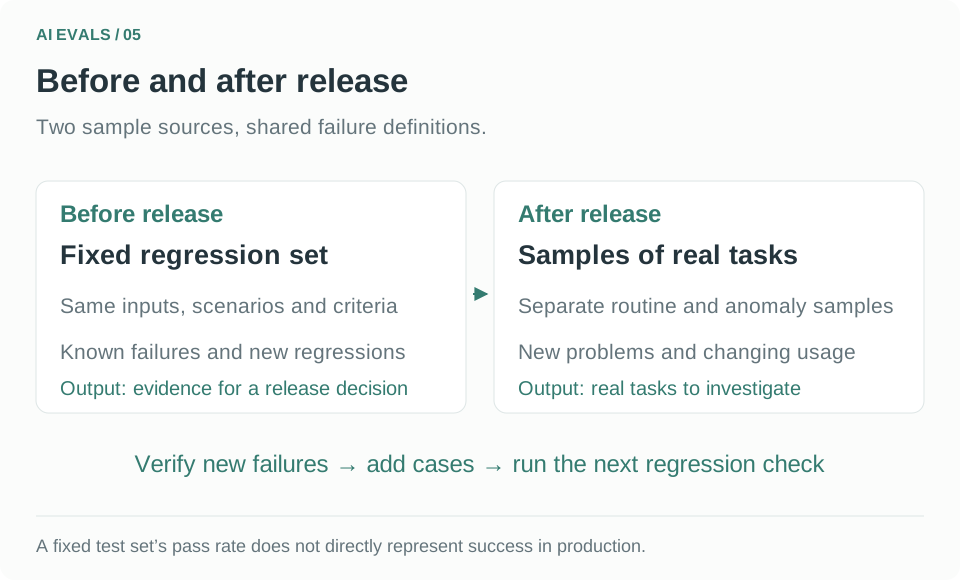
Figure 5: Offline checks cover known scenarios; online sampling discovers new problems. They share failure definitions, but their sample rates are not interchangeable.
| Stage | Main inputs | What to examine | Response when triggered |
|---|---|---|---|
| Development and CI | Versioned cases, inputs, and tool scenarios | Critical assertions, new regressions, known failures | Locate the specific case, fix it, and rerun |
| Release decision | Controlled version comparison and human spot checks | Quality requirements, scenario differences, latency, and cost | Verify that regressions and costs are acceptable; record uncovered scenarios |
| Production sampling | Real tasks collected with consistent sampling rules | New failures, unresolved reviews, changing scenario mix | Check traces and sampling changes before diagnosing causes |
| Business review | Final task outcomes, human review, and rework | Whether the first delivery is usable, whether handoff resolves the task, and total human effort | Determine whether the user's work actually improved |
For example, when alerts for “missing sources presented as complete” increase, first check whether one channel's API has started timing out. Then inspect whether the corresponding reports are actually wrong. More alerts alone do not establish that the model got worse, and an unchanged model does not rule out an application failure.
Every dashboard should include the time window, task count, sampling method, applicable scenario count, Needs review count, and application and judge versions. For small samples, show the numerator and denominator directly. Set automatic thresholds using business consequences, sample size, and historical variation, and report uncertainty. Do not copy a rule such as “alert below 90%” from another team.
An alert starts an investigation. A well-evidenced, high-impact error such as sending a report without authorization may require immediate action even once. Lower-impact metric fluctuations call for examining repetition and sample composition. They should not share one average-score threshold.
Human handoff is part of the task
Suppose the assistant hands a missing-channel task to a colleague, who then spends 20 minutes finding the file and reconstructing context. Counting “handed to a human” as completion hides the time the user actually spent.
At minimum, record the handoff reason, information already known at handoff, waiting and handling time, and whether the task was ultimately resolved. Low handoff rates do not make a system better if it frequently invents conclusions. Conversely, routing every difficult task to a person does not establish high automation quality.
What belongs to evals, and what belongs to runtime protection?
The “generate a draft, do not send” boundary should be enforced through permissions and tool limits in the execution path. Offline evals check whether the system attempted to cross that boundary. A judge running after report generation should not be your only protection for authorization.
Similarly, if a checker triggers an automatic rewrite, reevaluate the rewritten output and the actual state. A second draft pleasing the same scorer does not establish task completion. The evaluator measures behavior; the repair workflow itself also needs validation.
13. Make this part of the team's regular work
For an initial review, someone who understands the task can own judgments while an engineer gathers complete tool evidence. Record disagreements against specific cases: was the business requirement unclear, or did the system fail to meet it? Settle the judgment before discussing implementation causes and repairs.
Each round should produce at least three inspectable outputs: new or revised failure definitions, issues to fix, and cases to add to reruns. An average score alone is not enough.
As the sample grows, AI can help search for similar traces, organize existing notes, and suggest categories. People who understand the business should still verify new failures and disputed labels. If every review requires finding one amount in thousands of log lines, improve the record viewer so inputs, tool results, and report evidence can be followed together.
New production problems return to the same workflow. Fixed prerelease cases check whether known failures have returned; real-task sampling finds situations the fixed set does not yet cover. Record the provenance of each sample separately. A test-set pass rate is not production reliability.
A checklist for your first review
To start today, choose a task that has already occurred. Open its request, execution record, and final deliverable, then fill in this template:
Task ID:
Sample source / why it was selected:
What the user actually wanted to accomplish:
Existing business constraints:

Final judgment: Pass / Fail / Needs review
Output or artifact supporting the judgment:
Tool events supporting the judgment:
First observable deviation:
Other independent problems:
Impact on the user:
What correct behavior would look like:

Provisional failure category:
Cause hypothesis, separate from known facts:
Evidence still missing:
Next step: fix implementation / add data / clarify rules / add checks
Inputs and tool scenario to add to regression tests:
Complete this record for one task, then find a similar task to test your judgment. Once you can say precisely where the problem occurs and what would count as a fix, you have something concrete to evaluate.
Further exercises
- Does This Skill Actually Help? From OpenAI's Method to a Runnable Eval: Keep practicing with fixed inputs, process evidence, and rule-based checks.
- Your Team Uses AI. Where Are the Savings?: Include human review and rework instead of looking only at generation speed.
- Maintain Team Skills: Turn validated practices into rules the team can keep maintaining.