Sometimes the answer should be visual
A lot of AI work dies in paragraphs. You ask for an architecture explanation and get a wall of text. You ask for a launch plan and get bullets. You ask for a dashboard idea and get prose. The information is there, but the artifact you actually need is missing.
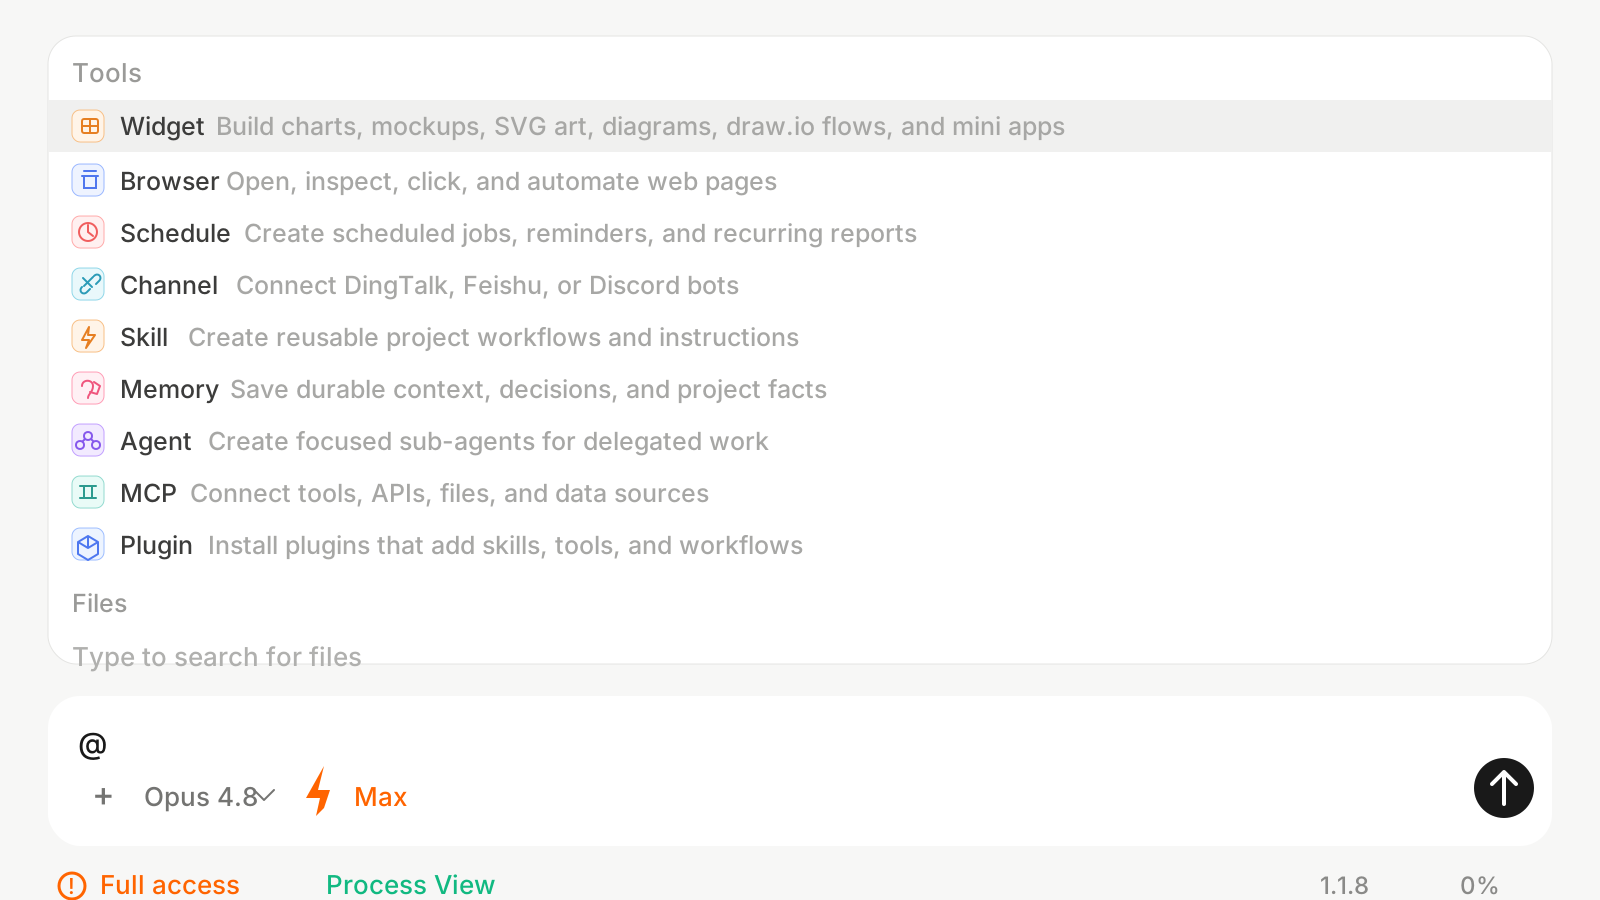
The Widget tool exists for those moments. It tells Onevium that the output should become a visual or interactive artifact: a chart, a mockup, an SVG diagram, a draw.io-style flow, or a mini app. Instead of describing the thing, the assistant builds the thing.
This is especially useful for product and engineering teams because visual artifacts travel better than chat transcripts. A decision tree can go into a spec. A benchmark chart can go into a release note. A UI mockup can start a design review. A small calculator can help a team reason about pricing, usage, or cost.
What users actually ask Widget to do
The best Widget prompts start with a messy thought and end with something you can inspect. You do not need to know the final layout before asking. You describe the intent, the audience, and the data, then let Onevium shape the first version.
- Explain a system visually. "Turn this auth flow into a sequence diagram with login, token refresh, and failure paths."
- Compare options. "Build a decision matrix for Sonnet vs Opus vs Haiku for support automation, including cost, latency, and reliability."
- Mock up a product state. "Create a compact settings panel for memory controls with toggles, helper text, and empty states."
- Make data readable. "Turn these weekly traffic numbers into a chart and call out the inflection points."
- Prototype a small utility. "Build a tiny calculator for estimating monthly scheduled-run cost from runs per day and average tokens."
Why Widget belongs next to code and browser tools
A standalone chart generator can make a pretty picture. A standalone design tool can make a mockup. The useful part of Widget inside Onevium is that it lives next to your project, browser, memory, and files.
That means the assistant can read existing product copy before drafting a mockup. It can inspect a live page in the Browser before proposing a UI state. It can use Memory to remember your design conventions. It can turn a scheduled report into a chart instead of a text summary. The artifact is not disconnected from the rest of the workflow.
For engineering teams, this is a quiet but important shift. Architecture diagrams, test dashboards, migration maps, and release visuals can be generated from the same context the model used to understand the codebase.
A good Widget prompt template
If you want better visual output, give Widget four pieces of information: the audience, the artifact type, the source material, and the decision the artifact should support.
For example: "Use @Widget to create a one-screen architecture diagram for new engineers. Base it on these three files and this deployment note. Show request flow, background jobs, data stores, and where failures are retried. Keep it readable in a docs page."
That prompt tells Onevium what to build, who it is for, what context matters, and what success looks like. The result is usually far more useful than asking for "a diagram" in isolation.
Where this helps most
Widget is strongest when a team needs shared understanding quickly. It is not just for polished design work. It is for turning rough reasoning into an artifact that can be reviewed, corrected, and reused.
- Product specs that need quick UI sketches before implementation.
- Engineering docs that need architecture diagrams instead of paragraphs.
- Launch notes that need a visual explanation of what changed.
- Support playbooks that need flowcharts for diagnosis.
- Internal reports that need charts people can understand in ten seconds.